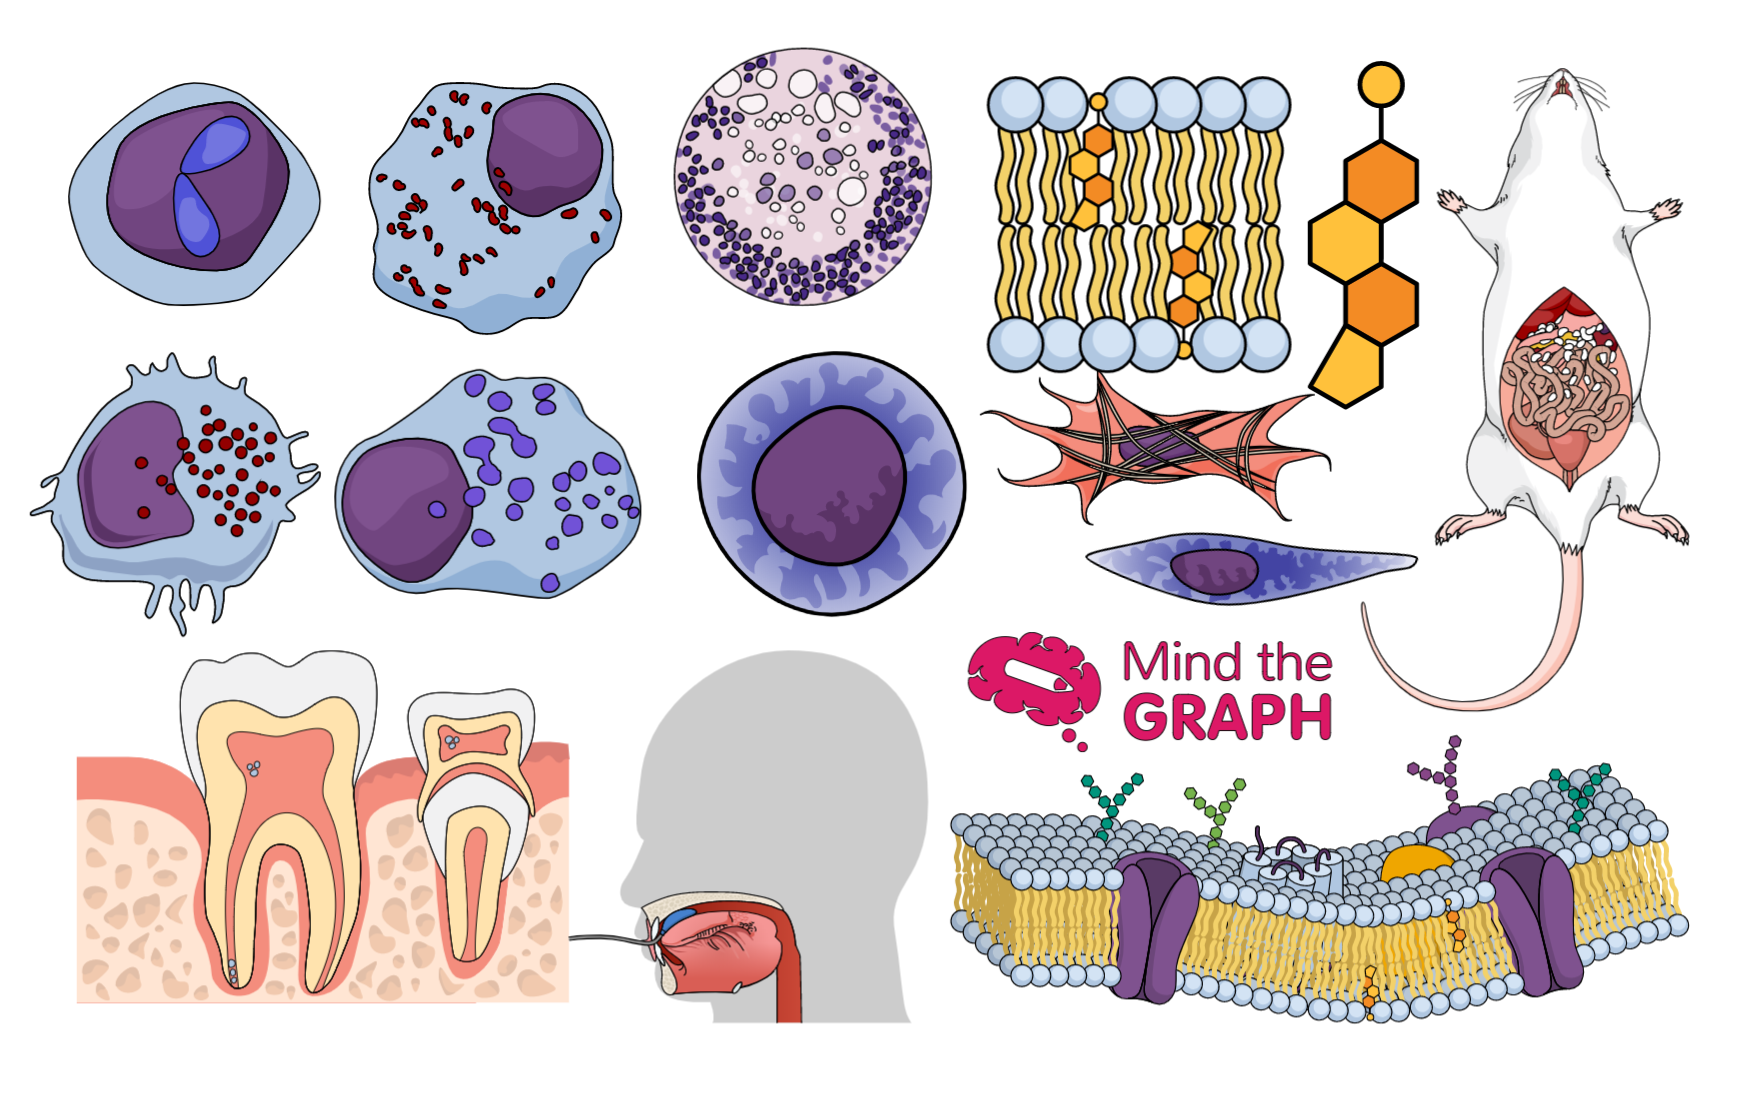
Hi there! As you may know, Friday is the day to share the new scientific illustrations available on mind the graph. This week we added several exclusive life science illustrations. Our illustrations are available to all mind the graph users (free users included).
Check this post to see the newest life science illustrations but keep in mind that these figures below are only a small sample of our complete library. To access all illustrations just start using mind the graph.
Agriculture and agronomy illustrations
Farmer and plantation field
Fertilizer and pesticides
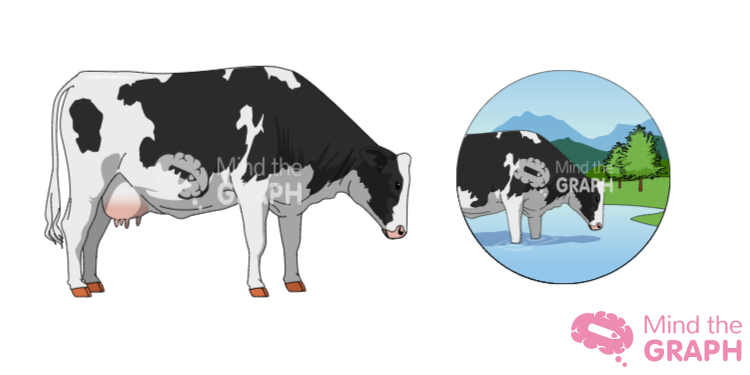
Farm animals
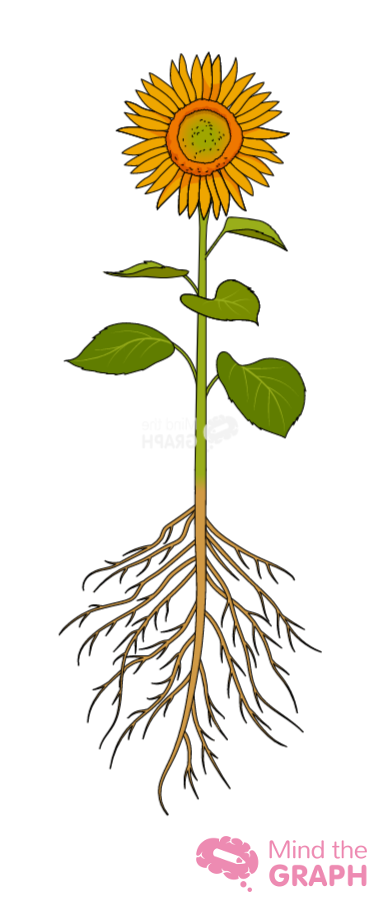
Sunflower – with roots, stalks and leaves
Lab animals and in vivo experimentation
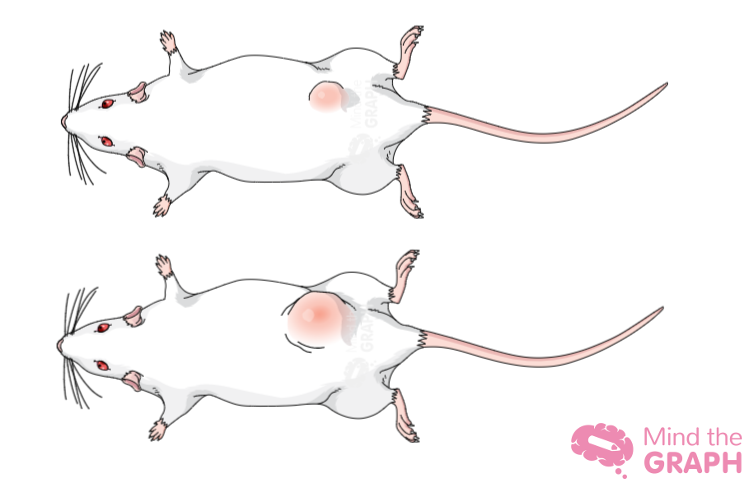
Rat tumor progression
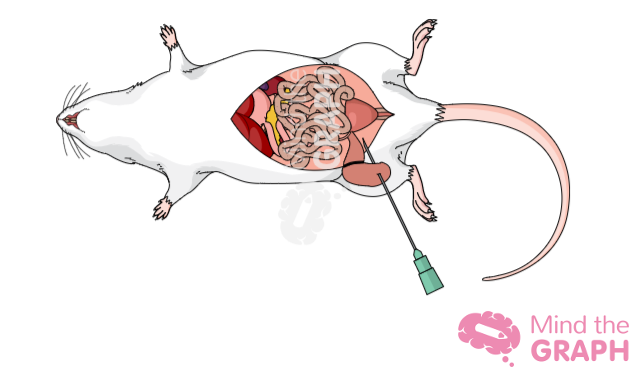
Cecal Ligation Puncture Procedure in mouse
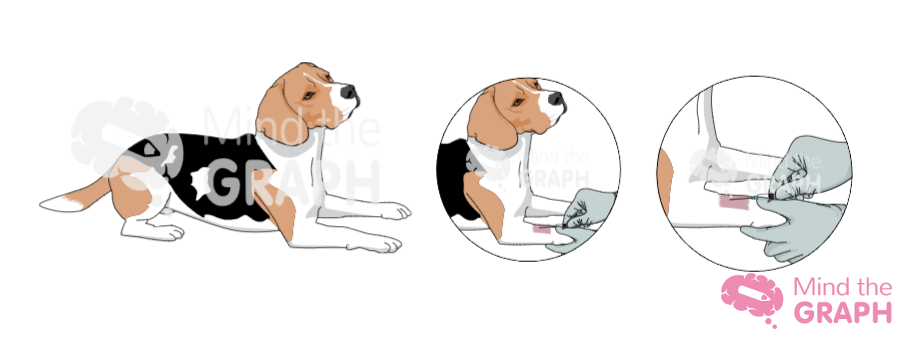
Beagle cephalic catheter placement
Feed pellets
I want to use life science illustrations from mind the graph. How can I do that?
Mind the Graph is an online platform that allows scientists and teachers to create their own presentations, papers and graphical abstratcs in an atractive and professional way. So, you can try it for free and check all the illustrations available. Besides that, you can combine the figures with shapes, charts, text and upload your own images to make an entire presentation. You can be a free user as long as you want but you will have limited features.
However, with a few dollars per month you can experience unlimited features. In addition, you will be able to request new illustrations at no extra cost. Actually, most of our illustrations are based on requests from our subscribers. Amazing, right?
We also have a help center with several tutorials and our terms of use. But if you still have any doubts, contact us on contact@mindthegraph.com
Feel ready to start?

Subscribe to our newsletter
Exclusive high quality content about effective visual
communication in science.


