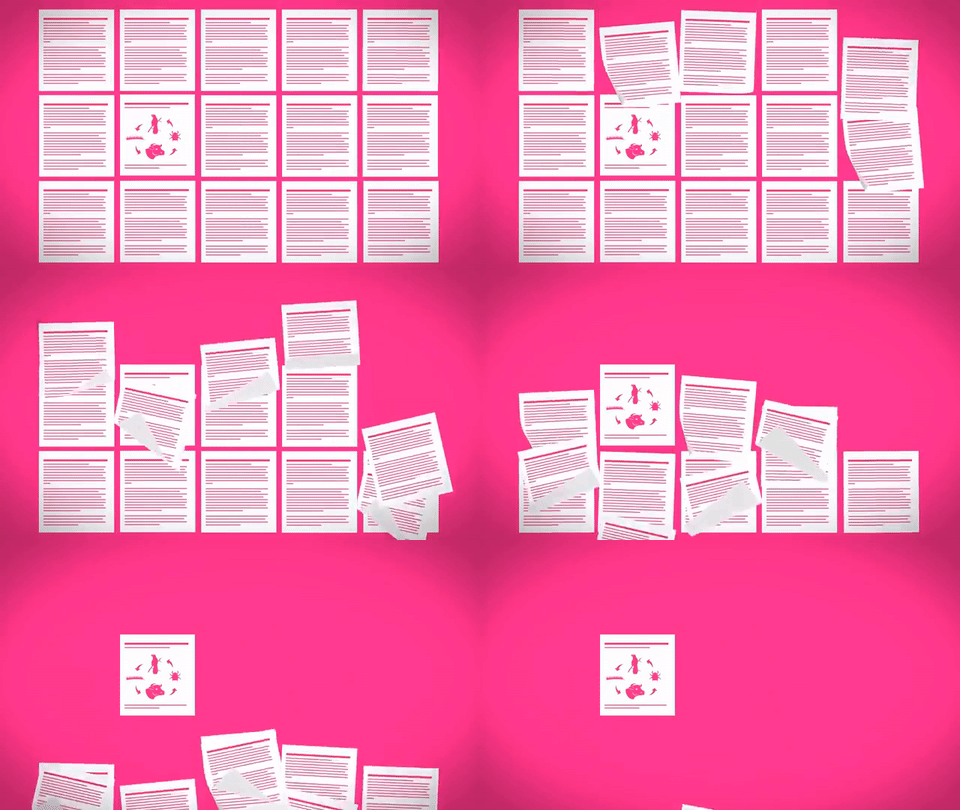
What if you could have a figure browser to search for scientific illustrations? It sounds great, but does it make sense? Does having a figure improves our research in addition to making it more visual? We always had the feeling that scientific papers with good figures are better than the ones without them. It is a very plausible assumption and can be endorsed by our routine when reading a new paper. The first thing we do is to check the title and abstract. Secondly, we scan the paper looking for self-explanatory figures to help us understand the study without costing much time.
For some people having the feeling about good figures was not enough. They needed to go a little bit deeper.
That was the case of Bill Howe and some of his colleagues at the University of Washington, in Seattle. They decided to collect data and make a research on the importance of figures in getting visibility for your paper.
The result corroborated the feeling about scientific papers with good figures. Indeed, they found a significant correlation between scientific impact and the use of visual information – in which a higher impact papers tended to include more diagrams. Yes, it is amazing to finally have data about a “popular rumour”. However, Howe and this team took this research to a new level.
Remember the idea of a figure browser? Well, after concluding that figures, diagrams, photographs, plots and tables have a major role in science communication, they created a figure browser. The browser called Viziometrics enables anyone to search for papers by their figures. How awesome is that??
Most scientists are stricted to their own studying field or are not very fond of long texts. Using a figure browser helps us to improve our work range. What if you could explain your research only using figures? Maybe you should stat doing it now!

Subscribe to our newsletter
Exclusive high quality content about effective visual
communication in science.


