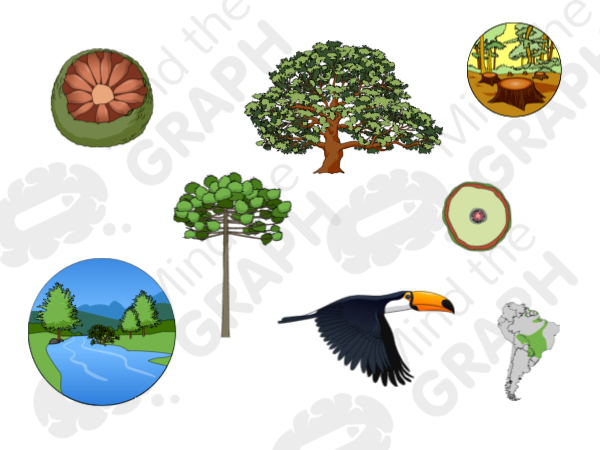
If you need scientific illustrations, here is the place, we have literally thousands of scientific illustrations for you, including several topics in Biology, Ecology, Life Sciences, Health Sciences and Medicine/Anatomy, even more specifics like forests, for exemple.
This is a collection of illustrations requested by clients, in this case, everything related to all types forest. Great for researchers, scientists and teachers.
Check a few examples of scientific illustrations already available on Mind the Graph. And even if you don’t find exactly what you need in the platform, try to subscribe to use the on demand scientific illustration service.
I wanna use scientific illustrations from Mind the Graph. How can I do that?
Ok, to use ours illustrations is very simple! Mind the graph is an online platform that allows scientists and teachers to create their own presentations, papers and graphical abstracts in an attractive and professional way. So, you can try it for free and check all the scientific illustrations available.
You can also combine, as we said above, the figures with shapes, charts, text and upload your own images to make an entire presentation, a graphical abstract or a scientific infographic. You can be a free user as long as you want but you will have limited features.
With a few dollars per month you can experience unlimited features as a subscriber. In addition, you will be able to request new illustrations at no extra cost. In fact, most of our illustrations are based on requests from our subscribers.
In addition, you will have the autonomy to assemble your own presentation and graphical abstract, asking only what is necessary for your research.
May I use these illustrations on my publications?
Yes.
Our goal is to improve communication in science and help scientists and doctors to communicate their results in an understandable and eye-catching way.
Therefore, you can use your creations in your papers, classes, books, social media and anything you want. But, if you are a free user, you must keep the watermark and cite mind the graph in your publication. Now, if you are a subscriber you don’t need to cite us (But would be great if you do it)!
[Ok, I wanna try the plataform!]

Subscribe to our newsletter
Exclusive high quality content about effective visual
communication in science.


