BREAKING NEWS: Mind the Graph has been upgraded!
What does it mean? That we have new features and new tools to improve your experience! And more: all features are available FOR FREE – but only for a short period, so enjoy!
Also, we count on our users feedback and inputs to improve the platform even more! So feel free to contact us at any moment.
Apart from the amazing new layout, we also have other news for you. Take a look:
- New tools for your workspace
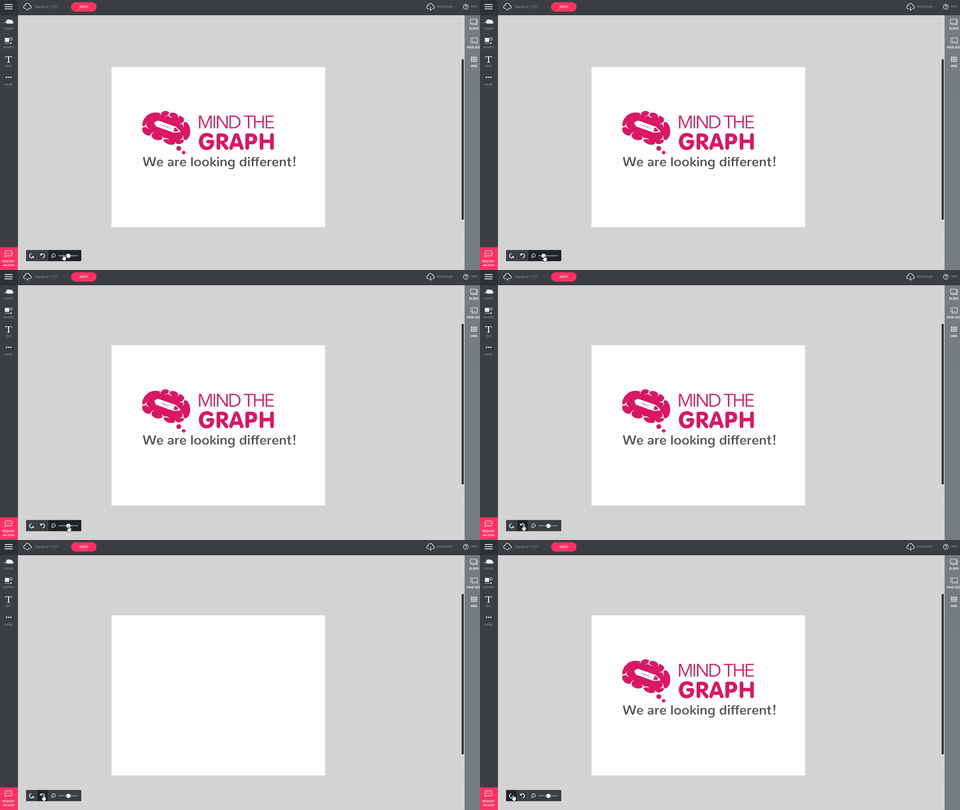
We have new tools such as Zoom, Undo and Redo buttons!
- Use the whole workspace to build your creation
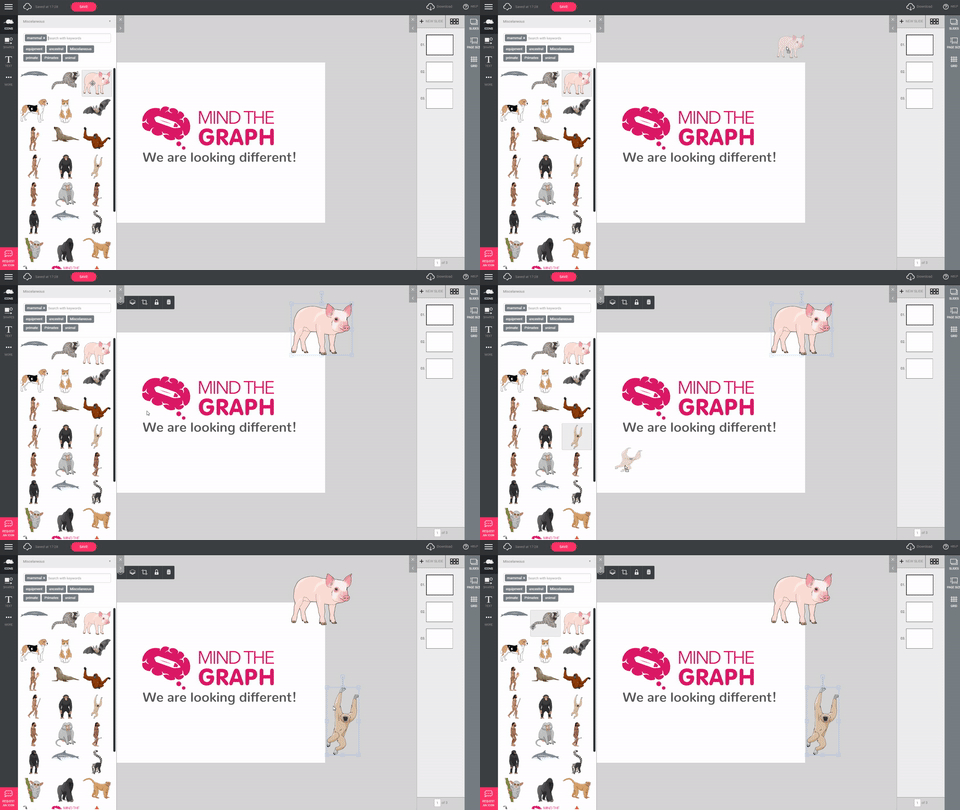
Now you have an extended workspace where you can keep the illustrations you like.
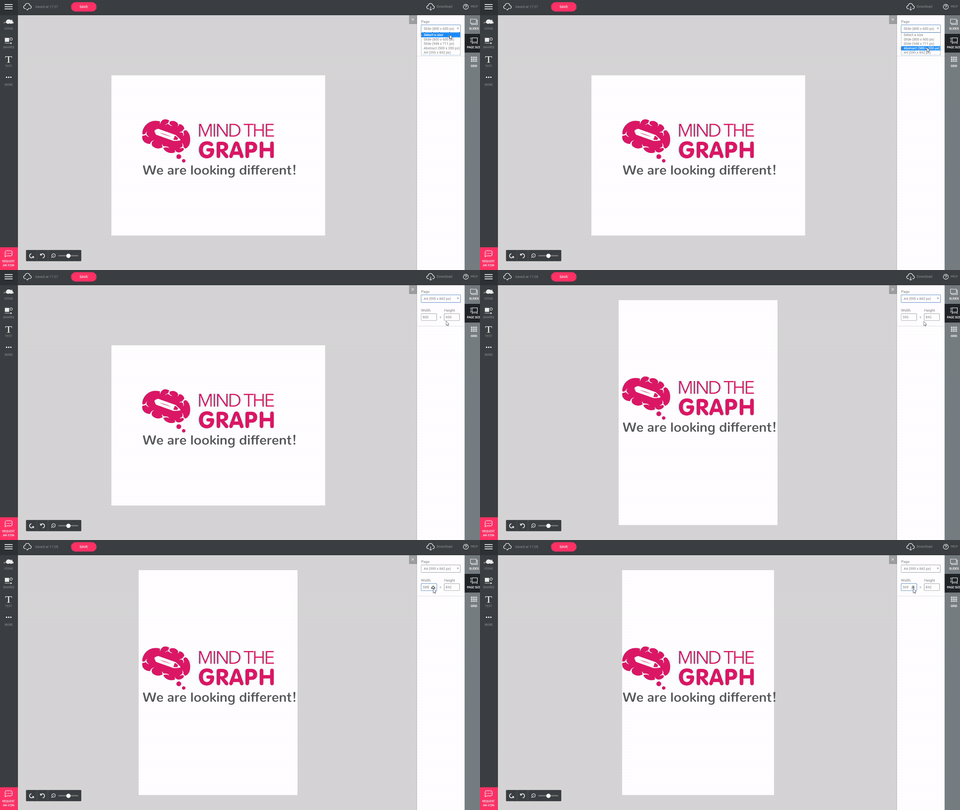
- Customize your canva while making it
Have you changed your mind about the canva format while making it? No worries, just customize it the way you want.
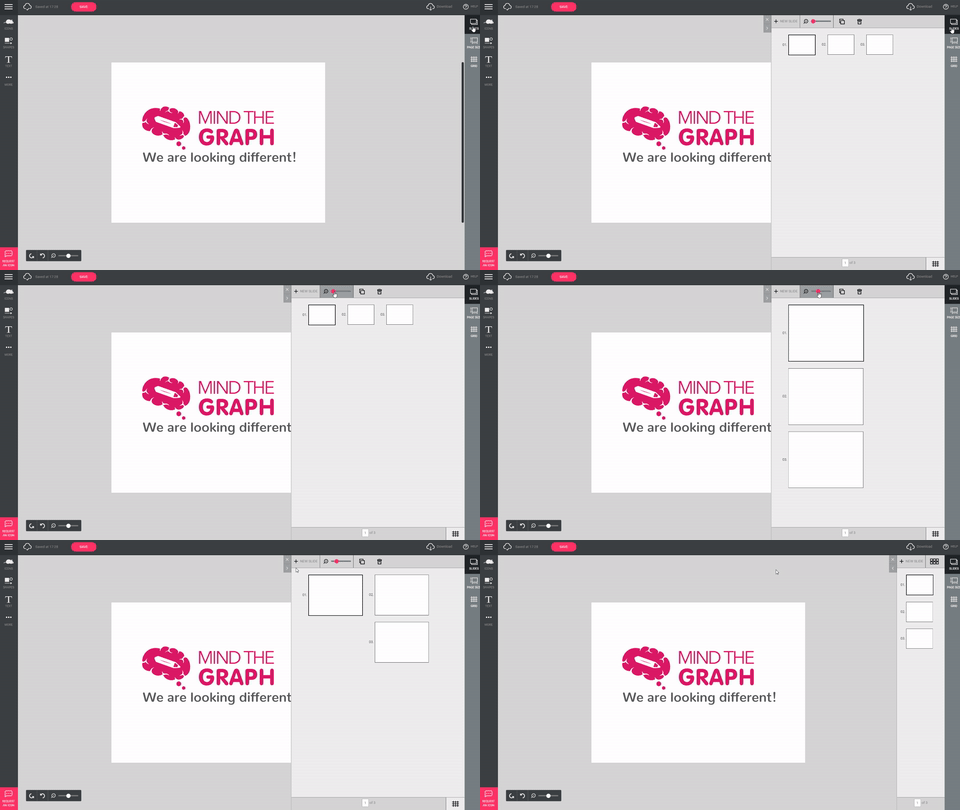
- Have as many slides as you want
Presentations, tutorials, infographics, etc. Just build your entire work using our platform!
- Customize the illustrations
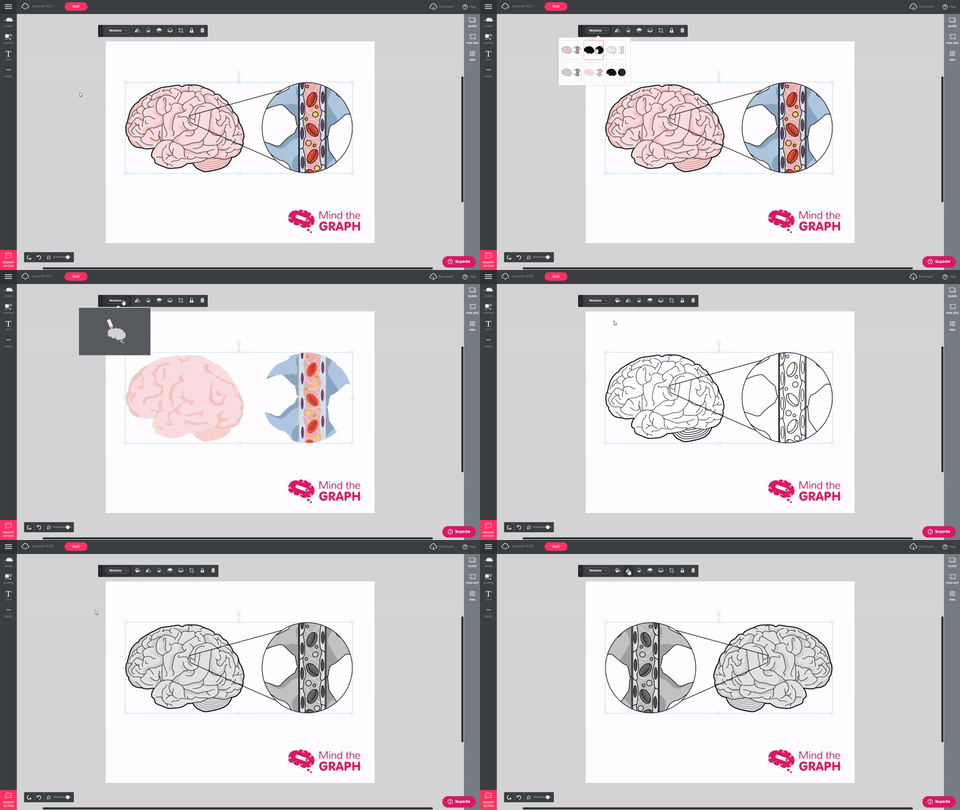
Need the illustrations in a different version or colour? Perfect! Just customize it the way you want.
All those chages came to make Mind the Graph even more useful to our users. That is because most scientists only need to make a graphical abstract or a scientific infographic when they are getting a paper published. However, we want Mind the Graph to be more useful than that! For this reason, now you can also make presentations at our platform. Mind the Graph aimes to be a platform that fullfills all scientists needs:
- Scientific illustrations on demand
- Infographic templates
- Slides to make full presentations
- Simple and intuitive workspace
- Science content relevant to our users
We are always open to hear feedbacks and inputs on how our platform can get better and better. And we need your help!
So give it a try and enjoy the new updates. By the end of the day, all we want is to improve science communication by untangling science through visual and creative links.

Subscribe to our newsletter
Exclusive high quality content about effective visual
communication in science.


