1 min read
11/11/2015
Mind The Graph Scientific Blog is meant to help scientists learn how to communicate science in an uncomplicated way.
A celebration of brazilian press infographic, made by Visual Loop, brings together 50 amazing examples of infographic of various subjects published in magazines and newspapers. The topics include History, Health, Economy, Biology and more. It’s a way to honor the talented Brazilian professionals, including awarded authors like Luiz Iria and Alberto Cairo and disseminate the […]
A classic is a classic. However, it is difficult to define what makes something a […]
Public sector funding of synthetic biology projects is rising each year, and the numbers from the […]
Bias and cognitive fallacies. These are the most dangerous traps that a scientist should avoid. The […]
Coffee, is it good or bad for our health? This kind of question is not […]
Oxidative stress is bad because it can damage DNA and this is a way into […]
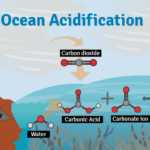
When bad media strikes, only a very good infographic can show the public the real […]
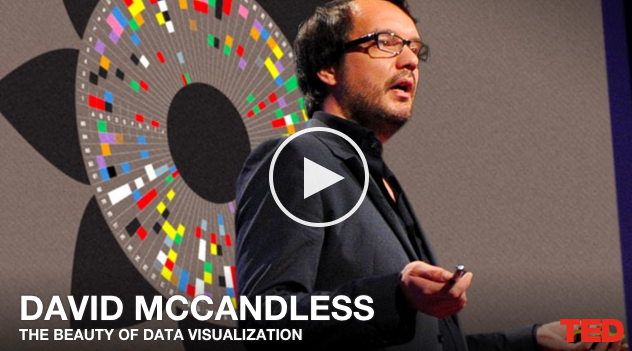
This TED talk was the beggining of everything for me. David McCandless, this genious of […]
Abandon all productive time, ye who enter here. A little adaptation from Dante´s Inferno as […]
Mind the Graph is a free infographic maker for Life Science and Health with the World’s largest gallery of illustrations. Read more.
A blog post listed the “Common Infographic Mistakes When Transforming Data Into An Infographic”, with […]
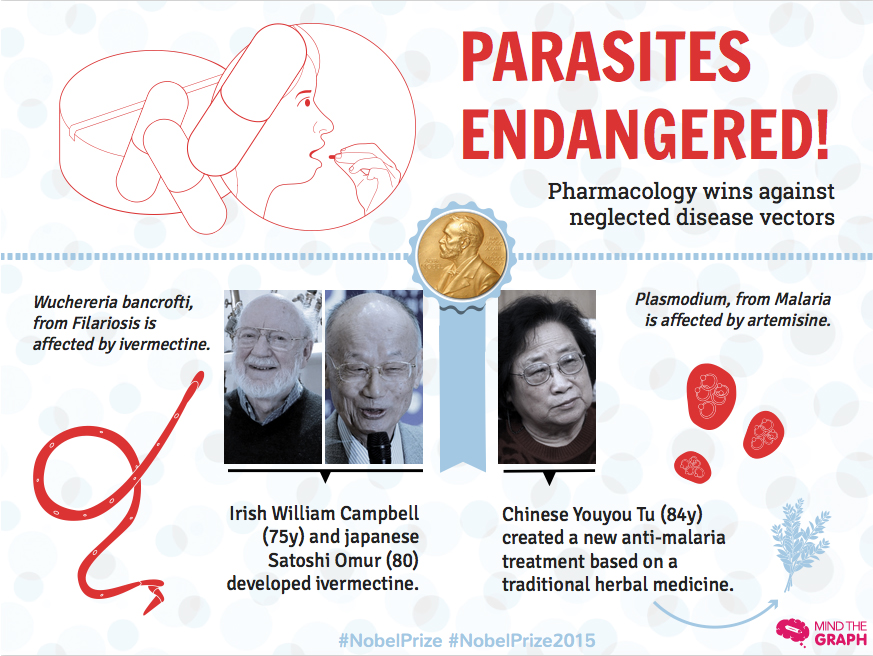
The Nobel Prize is not only a way to recognize great researchers, is a way […]
The Nobel prize 2015 in medicine was awarded to three scientists that have studied treatments […]

Unlock Your Creativity
Create infographics, presentations and other scientifically-accurate designs without hassle — absolutely free for 7 days!
Try it for free