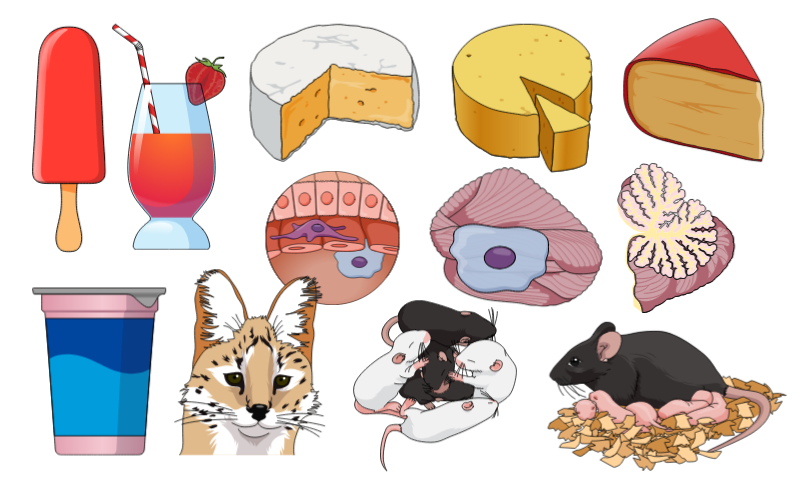
Oh yes! Mind the Graph is back from the holidays and ready for 2017!
2016 was a big year for Mind the Graph. We had amazing scientists all over the world collaborating with us; big business trips; huge changes in our platform to improve our customer’s experience; and – last but not least – we have vastly expanded our illustration library. Nevertheless, we couldn’t have done it without our amazing users.
Everyday we receive requests and suggestions for new illustrations. Did you know that a huge part of our illustration library is composed by users ideas and needs?
Unfortunately scientists still struggle with absence of scientific illustrations to help them explain better their work. For this reason, it is so important that our users understand that Mind the Graph is here to help and improve science communication with them.
In the post “Scientific illustrations? Ask us!” you can see a couple of previous requests. Here are some new users requests that became Mind the Graph illustrations!
Chemotherapy patient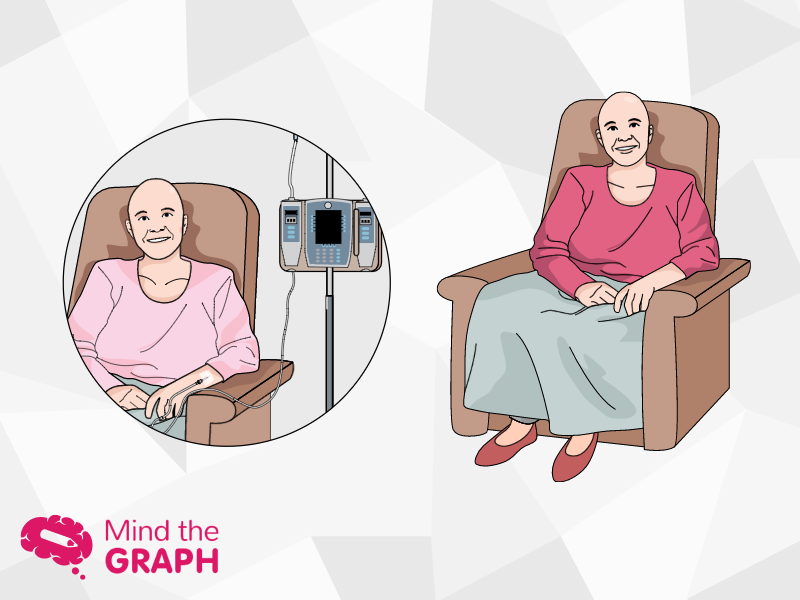
Colon cancer-related images
Paw edema model in rats 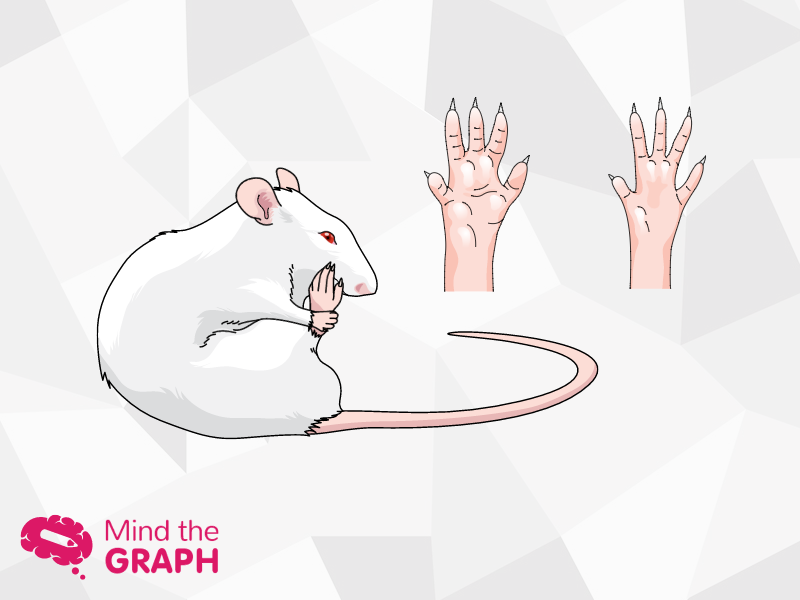
Pests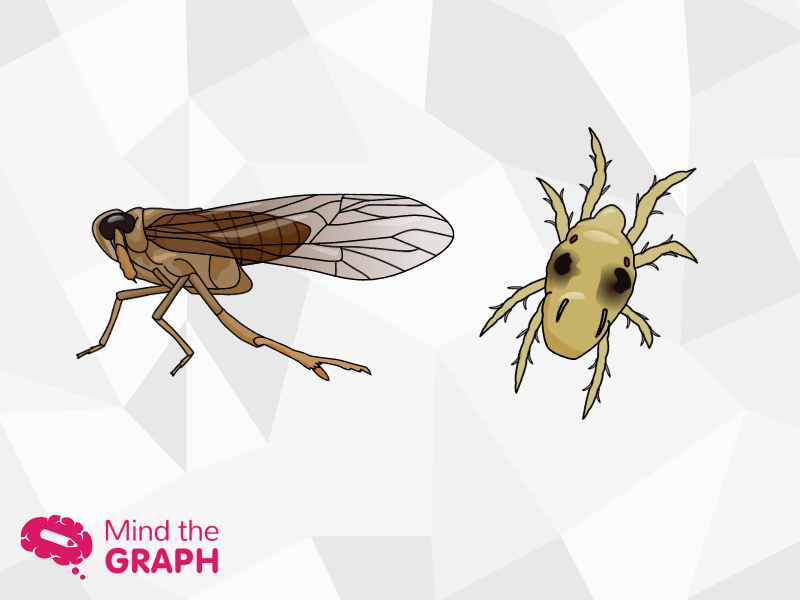
Transcription and the splicing cycle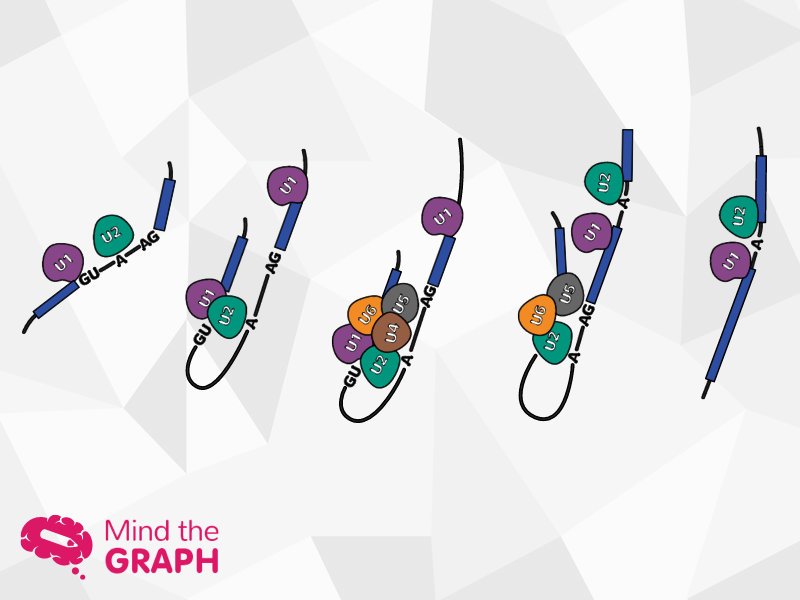
Rat circulatory system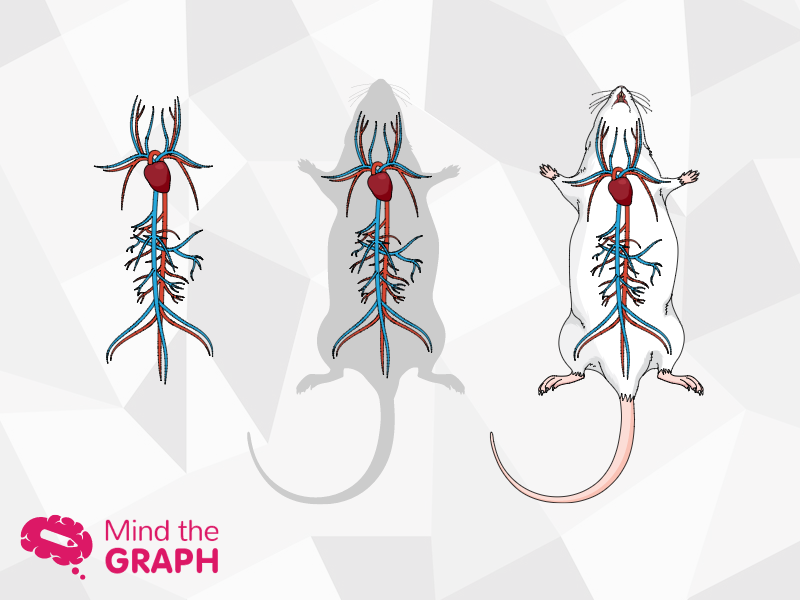
Armadillo with puppies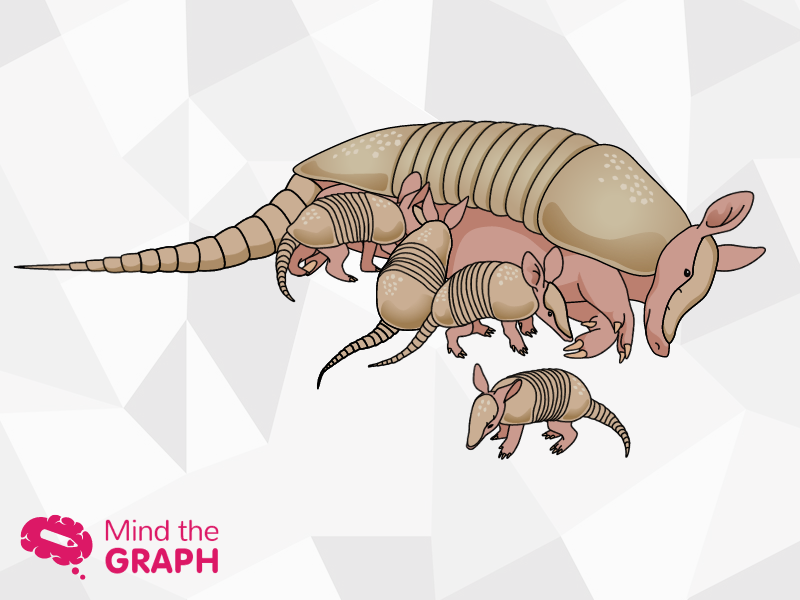
We still have a big list of new illustrations to make. If you are a free user and needs illustrations for your research, subscribe now! Click here.
If you are a subscriber and didn’t know you could request new illustrations, don’t waste your time anymore and contact us via our platform! Click here.
2017 will be an amazing year. We will have many new updates to make our users experience even better. If you want to help us with feedbacks our suggestions, don’t be shy! We love receiving e-mails from our users. If you missed the last updates we had, check out our post “Mind the Graph UPGRADE: New platform! More features!”.
Let’s start 2017 rocking, science folks!

Subscribe to our newsletter
Exclusive high quality content about effective visual
communication in science.

